
Execute mathematical operations accurately
Conducting Mathematical Equations for an Infographic
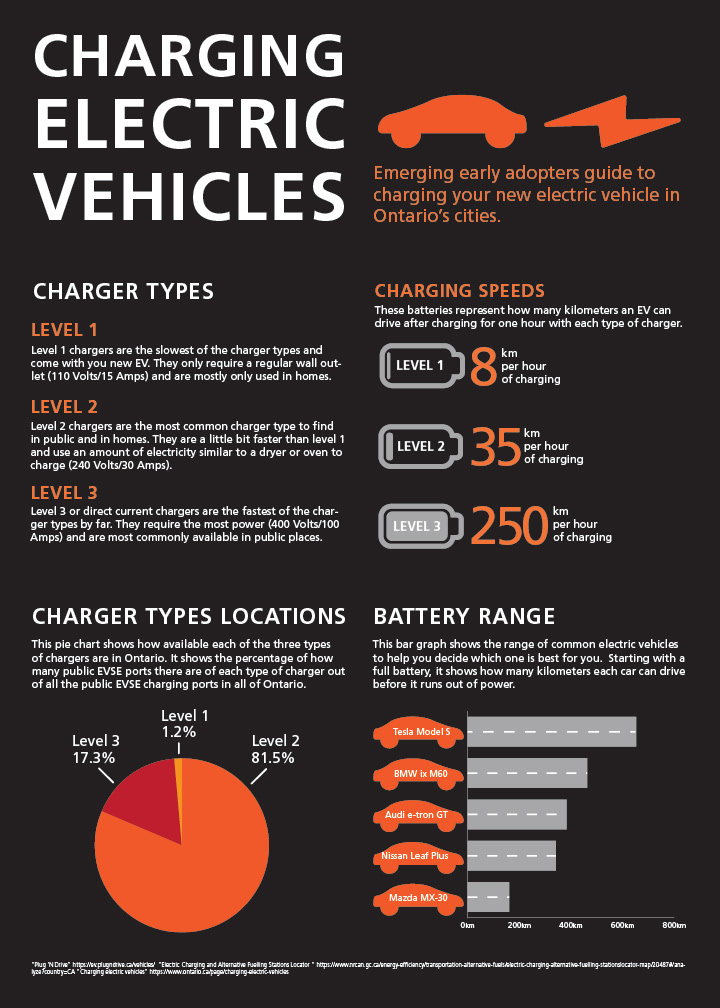
As apart of my Information Design course, I designed an infographic using numerical statistics visualized into charts, graphs, and other visual representations. The topic of the infographic poster was charging electric vehicles and the types of chargers, their charging speed, the locations of these chargers, and the battery range of common electric vehicles. The information was gathered through research and used mathematical operations to provide the viewer with accurate numerical information about electric vehicles. The pie chart was created by calculating statistics into percentages to be shown as fractions on a pie chart. The infographic was designed to visualize the statistics and calculations into easily understood graphs and charts including a bar graph and a pie chart.
Mounting Projects with Mathematical Equations

I have mounted several print projects using mathematical equations to center a print piece on a mounting paper with even margins all the way around. I was able to calculate the margins to find out where the piece needed to be placed on the mounting paper by taking measurements and marking up the back of mounting paper. I first measured the width of the mounting paper and the width of the piece I was mounting. Then, I subtracted the width of the piece from the width of the mounting paper and divided the answer by two to find the width of the left and right margins. I did the same for the heights of the piece and the mounting paper to find the top and bottom margins. I then marked these measurements on the back of the mounting paper and used a thumbtack to indicate where the corners of the piece should be. I am able to accurately execute mathematical equations to successfully center my print pieces on mounting paper.